EventCatalog now indexes every field from every message schema and lets you search, filter, and trace fields across your entire architecture. Scale plan users get Field Intelligence with type conflict detection and interactive traceability graphs.
EventCatalog now indexes every field from every message schema in your architecture and makes them searchable, traceable, and verifiable, all from a single page.
This is Schema Insights, available now at /schemas/fields in EventCatalog.
The problem with growing schemas
As architectures grow, schemas multiply. An OrderPlaced event gains fields. A PaymentProcessed event reuses some of those same fields. A CustomerUpdated command redefines one of them with a slightly different type. Nobody notices until a consumer breaks.
At small scale, you can track this manually. At any meaningful scale, you cannot. The questions that seem simple, "where is customerId used across our architecture?", "does timestamp mean the same thing everywhere?", become genuinely hard to answer. The information is buried across dozens of schema files across multiple services and domains.
Introducing Schema Insights
Schema Insights indexes every field from every message schema and surfaces them in one place. It supports JSON Schema, Avro, and Protobuf. At startup, EventCatalog builds a SQLite index of all fields across the latest version of every message in your catalog. The result is a searchable, filterable table that gives your whole team visibility into the data model of your architecture.
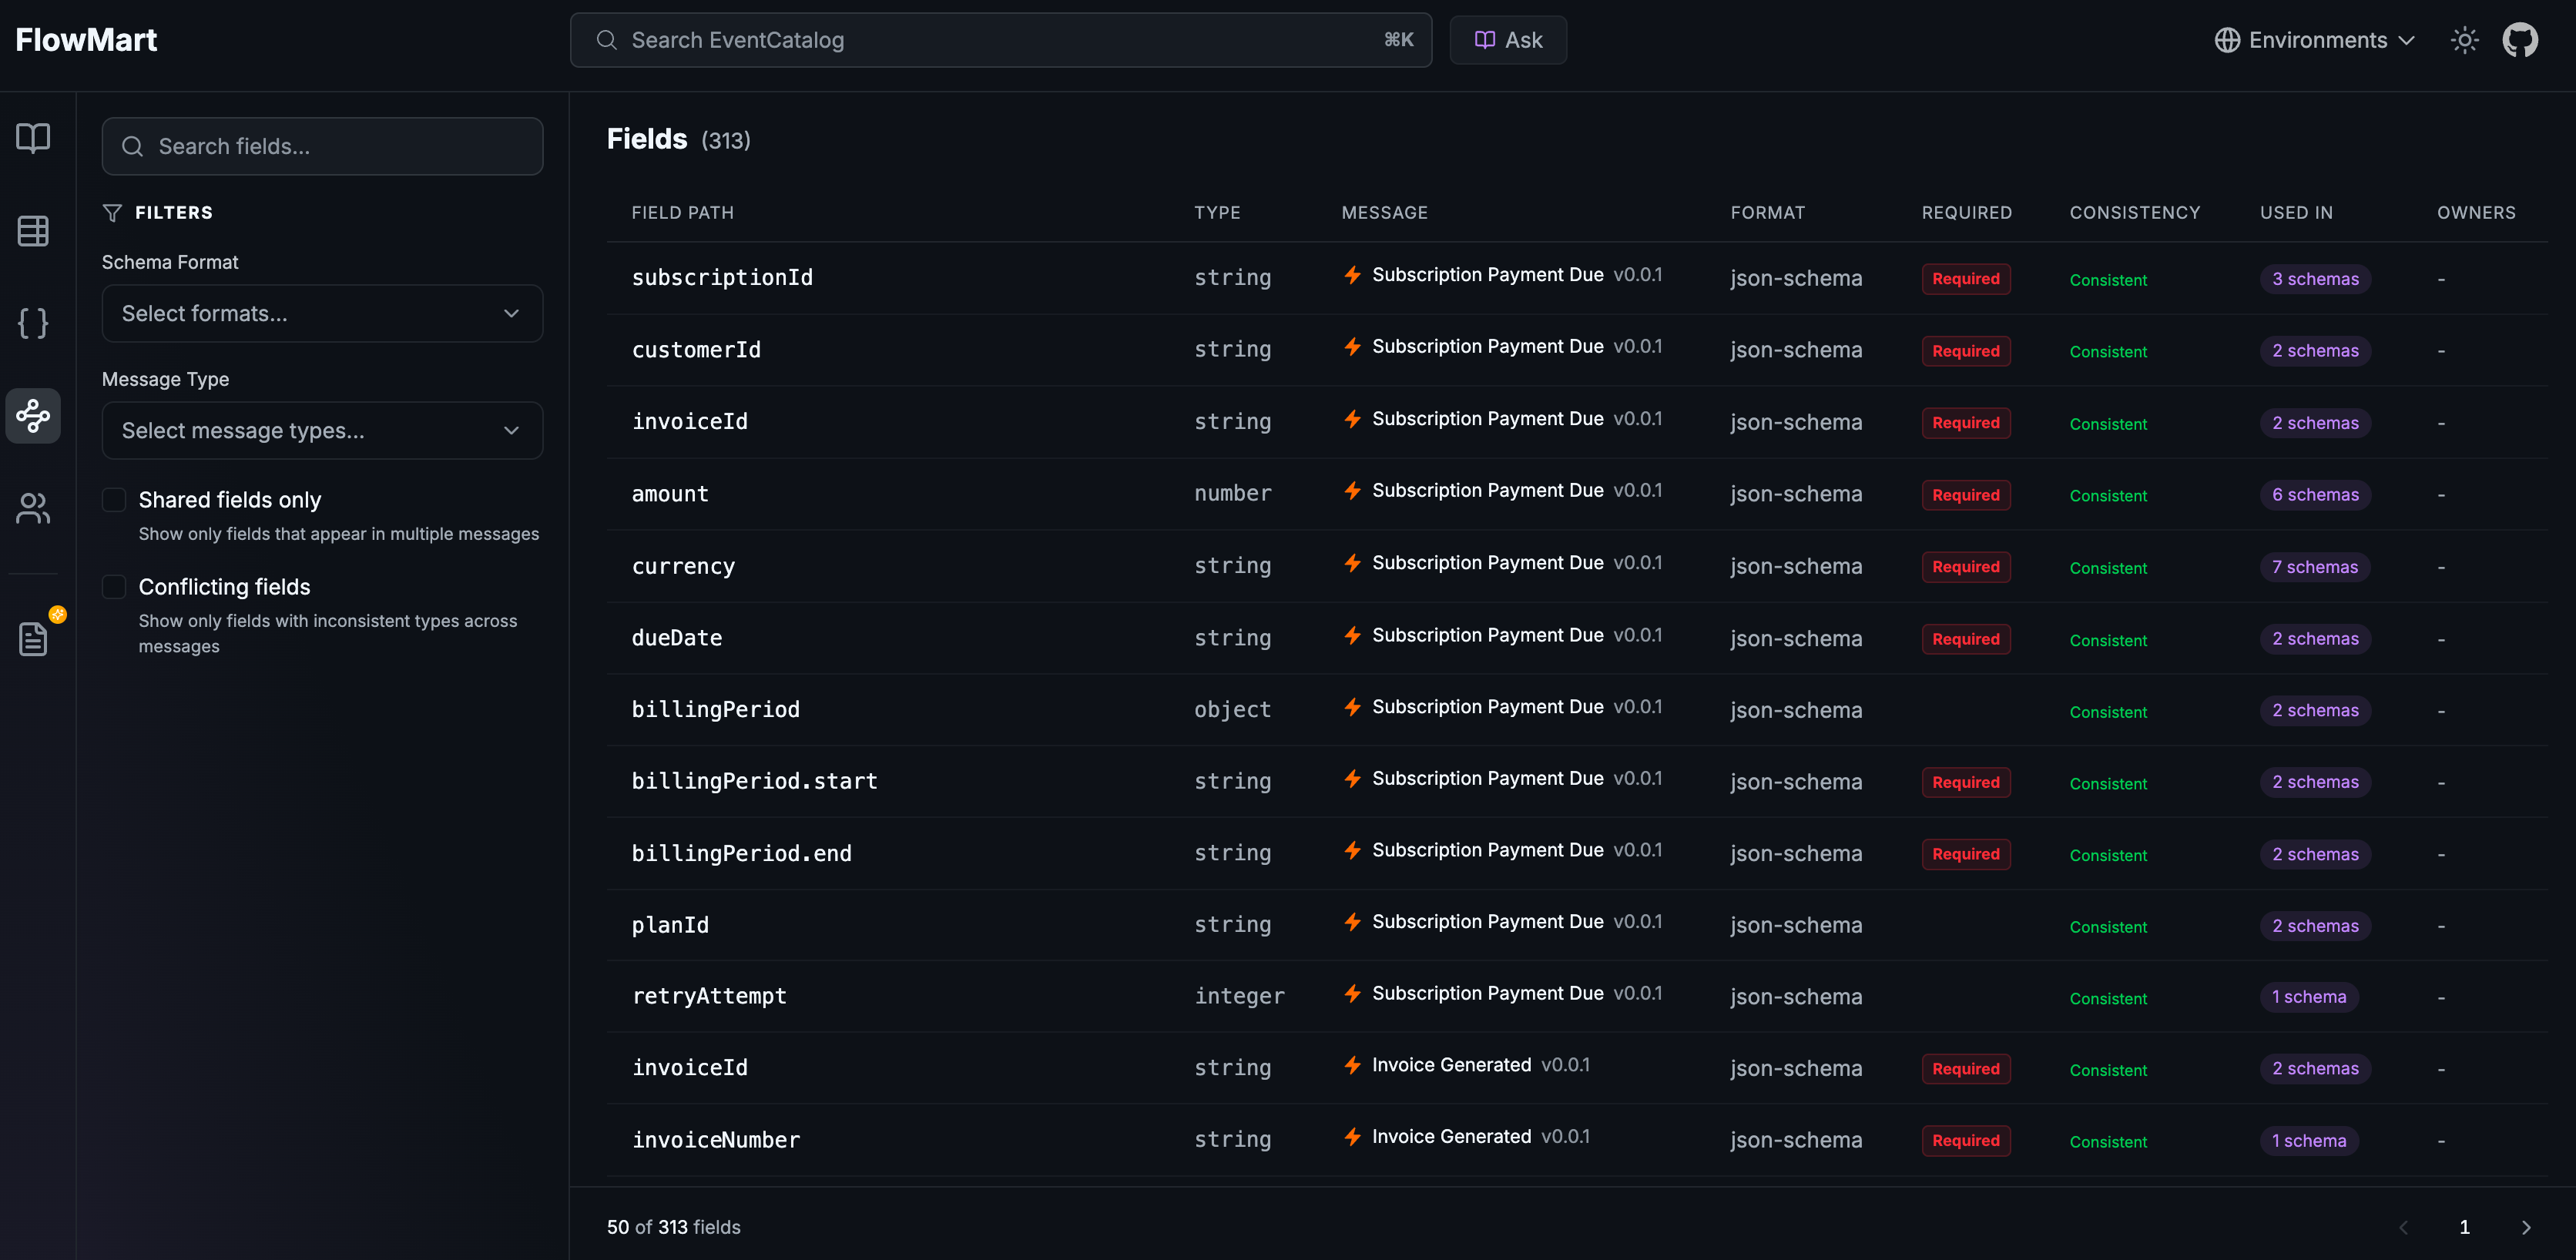
Schema Insights shows every indexed field with its type, message, format, and usage countEvery field entry shows its path, type, which message it belongs to, the schema format, whether it's required, and how many messages use it. Full-text search across field names is included for free. Filter by schema format (JSON Schema, Avro, Protobuf) or by message type (event, command, query) to narrow things down fast.
What's included
Schema Insights is available on all plans. You can browse and search all fields across every schema in your catalog, filter by format and message type, and see each field's type, required status, and which message it belongs to.
With a Scale plan, you also get Field Intelligence:
- Shared field discovery: see when a field like
customerIdappears across 12 different messages, with a count shown in the "Used In" column - Interactive traceability graphs: click any field to see a visual graph showing that field at the center, connected to every message that contains it, and the services that produce or consume those messages
- Type conflict detection: when the same field name carries inconsistent types across schemas, EventCatalog flags it with an amber warning badge
Type conflict detection
When the same field name appears across multiple schemas with different types, that inconsistency is a ticking clock. A timestamp field that's a string in eight schemas and a long in one is a consumer integration bug waiting to happen.
 Amber "2 types" badge flags fields with inconsistent types across schemas
EventCatalog surfaces these conflicts as amber badges directly in the field table. A filter lets you show only conflicting fields, so you can go straight to the problems. You can also filter to show only shared fields, for a quick audit of what your architecture is reusing.
 The traceability graph side panel shows the exact type conflict details, including which messages carry which type
Interactive field traceability graphs
Clicking a field on a Scale plan opens a traceability graph. The field sits at the center. Every message that contains it connects to it. Every service that produces or consumes those messages is a node on the graph.
 The field traceability graph shows a field connected to all its messages and the services that produce or consume them
This answers the question "where does this data flow?" in seconds. You can see at a glance whether a shared field is consistent across producers, which services are involved, and whether anything looks unexpected.
How it works
At build or start time, EventCatalog scans all message schemas in your catalog and builds a field index stored in .eventcatalog/fields.db. Only the latest version of each message is indexed. The index stores field path, type, required status, format, and the message it belongs to.
This feature requires SSR mode. The /schemas/fields page is served dynamically and queries the SQLite index at request time. If you're already running EventCatalog in SSR mode, the page is available immediately after upgrading. If you're running in static mode, you'll need to enable SSR to use it.
Schema Insights is accessible from the sidebar under "Schema Explorer", alongside the existing schema browsing, diff, and API features.
 Schema Insights lives under Schema Explorer in the sidebar
When you'd use it
If you're onboarding onto a new codebase and need to understand what data is flowing through the system, Schema Insights gives you an indexed view of every field in every schema without reading each file individually.
If you're planning a schema change and want to know how widely a field is used, the shared field count and traceability graph tell you exactly which services would be affected.
If you're running a data governance or contract review, the type conflict filter surfaces every inconsistency in your architecture in one list. Fix them before they surface as production incidents.
Getting started
Upgrade to the latest version of EventCatalog. Start your catalog in SSR mode and navigate to /schemas/fields. The basic explorer is available on all plans. For Field Intelligence (traceability graphs, conflict detection, shared field analysis), you'll need a Scale plan license key. Not on Scale yet? Start a 30-day free trial.
Read the full Schema Insights documentation for configuration details and feature reference.
Summary
Schema Insights gives your team visibility into the data that flows through your architecture. Community users get a searchable, filterable index of every field across every schema. Scale users get type conflict detection and interactive traceability graphs that show exactly where each field travels.
Your schemas are already there. Now you can actually understand them.